Say that you have a cost function that gives you the total cost, C(x), of producing x items (shown in the figure below).
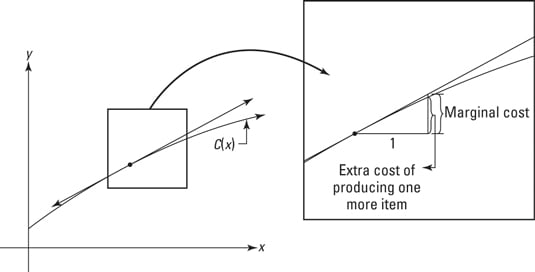
The derivative of C(x) at the point of tangency gives you the slope of the tangent line. Slope equals rise/run, right? So when the run equals 1, the rise equals the slope (which equals the derivative). On the little triangle under the tangent line, you run across 1 and then you rise up an amount called the marginal cost. And thus the derivative equals the marginal cost, get it?
Going 1 to the right along the curving cost function itself shows you the exact increase in cost of producing one more item. If you look very closely at the right side of the above figure, you can see that the extra cost goes up to the curve, but that the marginal cost goes up a tiny amount more to the tangent line, and thus the marginal cost is a wee bit more than the extra cost (if the cost function happened to be concave up instead of concave down like it is here, the marginal cost would be a tiny bit less than the extra cost).
So, because the tangent line is a good approximation of the cost function, the derivative of C — called the marginal cost — is the approximate increase in cost of producing one more item. Marginal revenue and marginal profit work the same way.
Before doing an example involving marginals, there’s one more piece of business to take care of. A demand function tells you how many items will be purchased (what the demand will be) given the price. The lower the price, of course, the higher the demand.
You might think that the number purchased should be a function of the price — input a price and find out how many items people will buy at that price — but traditionally, a demand function is done the other way around. The price is given as a function of the number demanded. That may seem a bit odd, but the function works either way. Think of it like this: If a retailer wants to sell a given number of items, the demand function tells them what the selling price should be.
Okay, so here’s the example. A widget manufacturer determines that the demand function for their widgets is
where x is the demand for widgets at a given price, p. The cost of producing x widgets is given by the following cost function:
Determine the marginal cost, marginal revenue, and marginal profit at x = 100 widgets.
Marginal cost
Marginal cost is the derivative of the cost function, so take the derivative and evaluate it at x = 100.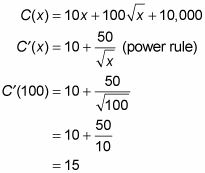
Thus, the marginal cost at x = 100 is $15 — this is the approximate cost of producing the 101st widget.
Marginal revenue
Revenue, R(x), equals the number of items sold, x, times the price, p: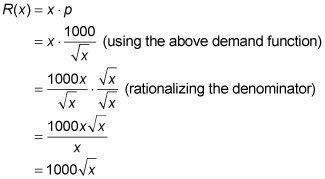
Marginal revenue is the derivative of the revenue function, so take the derivative of R(x) and evaluate it at x = 100:
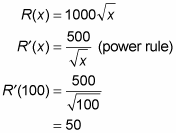
Thus, the approximate revenue from selling the 101st widget is $50.
Marginal profit
Profit, P(x), equals revenue minus costs. So,
Marginal profit is the derivative of the profit function, so take the derivative of P(x) and evaluate it at x = 100.
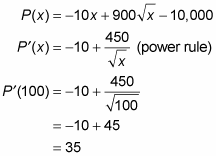
So, selling the 101st widget brings in an approximate profit of $35.
By the way, while the above math is exactly what you’d want to do if you were asked only to compute the marginal profit, did you notice that it was unnecessary in this example? Once you know the marginal cost and the marginal revenue, you can get marginal profit with the following simple formula:
Marginal Profit = Marginal Revenue – Marginal Cost.

