Although Excel 2013 automatically embeds all new charts on the same worksheet as the data they graph, you may find it easier to customize and work with it if you move the chart to its own chart sheet in the workbook. To move an embedded chart to its own chart sheet in the workbook, follow these steps:
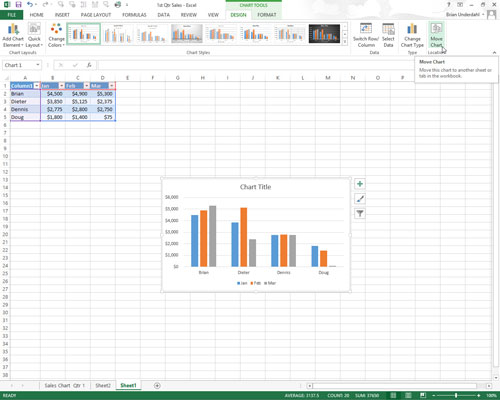
Select the chart and then click the Move Chart button on the Design tab under the Chart Tools contextual tab to open the Move Chart dialog box.

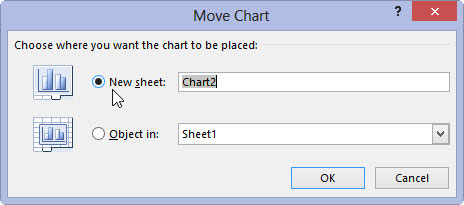
Excel will open the Move Chart dialog box.
Click the New Sheet button in the Move Chart dialog box.

Excel provides the default name for your new sheet.
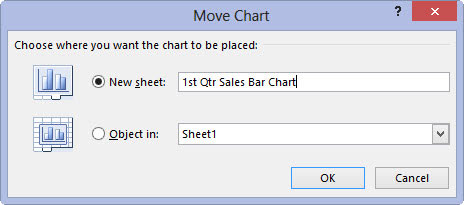
Rename the generic Chart1 sheet name in the accompanying text box by entering a more descriptive name.

This is an optional step if you would like to give your chart a specific name that better aligns it with its function. Chart 1 isn’t a very helpful name when you need to find it later.
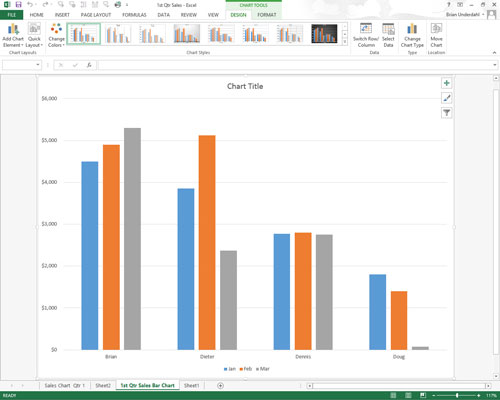
Click OK to close the Move Chart dialog box and open the new chart sheet with your chart.

If, after customizing the chart on its own sheet, you decide you want the finished chart to appear on the same worksheet as the data it represents, click the Move Chart button on the Design tab again. This time, click the Object In button and then select the name of the worksheet in its associated drop-down list box before you click OK.


