Serial correlation in the error term (autocorrelation) is a common problem for OLS regression estimation, especially with time-series and panel data. However, you usually have no way of knowing in advance if it’s going to be present, and theory doesn’t usually help you anticipate its presence. Consequently, you have to inspect your residuals to determine if they’re characterized by autocorrelation.
Looking over your residuals visually is an easy, informal way of checking for autocorrelation, but it should only be used as a complement, and not a substitute, for formal statistical tests of autocorrelation. Graphical examinations of residuals don’t provide conclusive evidence of the existence or nonexistence of autocorrelation. If you truly suspect autocorrelation, consider conducting one of the more formal statistical tests.
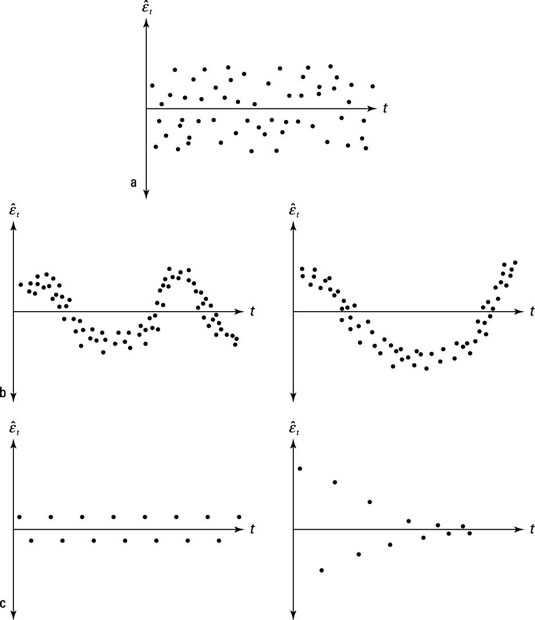
Using graphs for an examination of autocorrelation requires that you retain your OLS residuals and sort the data chronologically. Then you construct a scatter diagram, with the variable capturing your units of time on the horizontal axis and the residual values from your OLS regression along the vertical axis.
Part (a) in the figure illustrates the typical pattern of the residuals if the error term isn’t plagued by autocorrelation, part (b) exhibits the potential existence of positive autocorrelation, and part (c) displays negative autocorrelation.