


To save time when graphing a quadratic function on the ACT Math test, you can quickly find the location of the vertex of the parabola in relation to the y-axis. Just use the following simple trick based on the variables a and b (in the terms ax2 and bx):
When the signs of a and b are the same (either both positive or both negative), the graph shifts to the left. That is, the vertex of the parabola is to the left of the y-axis.
When the signs of a and b are different (one is positive and the other is negative), the graph shifts to the right. In this case, the vertex of the parabola is to the right of the y-axis.
A good mnemonic for remembering this rule is that the word same and the word left both have four letters.
Example
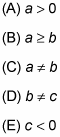
A quadratic function y = ax2 + bx + c crosses the x axis at x = 4 and x = –2. Which of the following must be true?
At first glance, you may think this difficult question isn’t even answerable. A quick sketch shows you that a lot of different parabolas could fit this description:
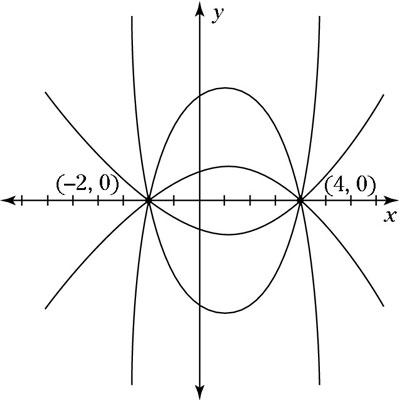
The only thing you know for sure is that the parabola’s vertex is horizontally in the middle of these two points, so it’s somewhere on the line x = 1. Thus, the parabola (whatever it looks like) is shifted to the right, so a and b have different signs. So a does not equal b, making the correct answer Choice (C).


