


After using Scenario Manager to add scenarios to a table in a worksheet, you can have Excel 2007 produce a summary report. This report displays the changing and resulting values not only for all the scenarios you’ve defined but also the current values that are entered into the changing cells in the worksheet table at the time you generate the report.
Open the workbook that contains the scenarios you want to summarize.
You create scenarios from the Data tab by choosing What-If Analysis→Scenario Manager in the Data Tools group.
Choose What-If Analysis→Scenario Manager in the Data Tools group of the Data tab.
The Scenario Manager dialog box appears.
Click the Summary button.
The Scenario Summary dialog box gives you a choice between creating a (static) Scenario Summary (the default) and a (dynamic) Scenario PivotTable Report. You can also modify the range of cells in the table that are included in the Results Cells section of the summary report by adjusting the cell range in the Result Cells text box.
Click OK to generate the report.
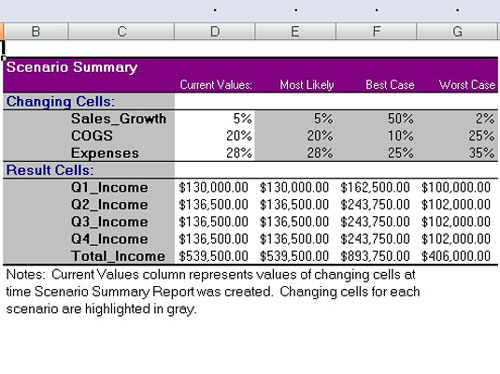
Excel creates the summary report for the changing values in all the scenarios (and the current worksheet) along with the calculated values in the Results Cells on a new worksheet.


