TI-Nspire allows two-way manipulation of data, which means that you can change values in the Lists & Spreadsheet application and watch a Data & Statistics graph update automatically. Likewise, you can click and drag dot plot points, histogram bins, and box plots and observe updates in the corresponding numerical data. Plotted values, such as the mean, update automatically as well.
How to manipulate dot plots on TI-Nspire
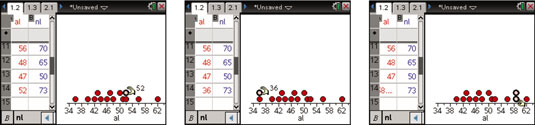
The first two screens show the result of moving the point corresponding to a value of 52 to a location with a value of 36. Remember, to grab a point, move the cursor to the point and press [CTRL][CLICK]. Then use the Touchpad keys to move the point and press [ENTER] to release it.
In the third screen, select and move two points. To select multiple points, click each point individually. Then press [CTRL][CLICK] to grab and move them as you want. To deselect points, move to an open space on the screen and press [CLICK].
Press [CTRL][ESC] to undo a manipulation.
This data is generated by typing commands in the formula row (the formula row is denoted by the
symbol). You cannot manipulate the graph of a data set that is dependent on a formula located in the formula row. However, you can manipulate graphs in which formulas are located directly in the cells of the spreadsheet.
If you manipulate data that is generated from formulas, the formulas are deleted and replaced with their numerical values.
How to manipulate histograms on TI-Nspire
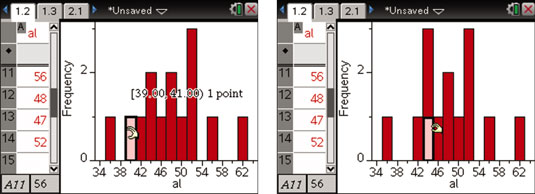
Here are the results of grabbing a bin containing one value and dragging it to a bin containing two values. The bin corresponding to values 39–41 is now empty, and the bin corresponding to values 43–45 contains three values. You can be assured that the data values contained in the Lists & Spreadsheet application have changed as well.
You may need to change your window settings after manipulating a histogram.
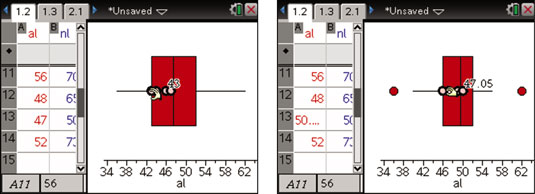
How to manipulate box plots on TI-Nspire
You can grab and move any of the four quartiles contained in a box plot. The first screen shows that you’ve pressed [CTRL][CLICK] and grabbed the second quartile. The number 44 displayed on the screen corresponds to the lowest data value contained within this quartile.
In the second screen, the Touchpad keys are used to translate all the points contained within this quartile 47.05 – 43 = 3.05 units to the right. Press [ENTER] to complete the translation and release the quartile.