


Many times, spatial datasets also have a field that indicates a date/time attribute for each of the records in the set — making it spatio-temporal data. If you want to create crime maps or uncover location-based trends in crime data, use spatial data analysis.
You can also use spatial analysis methods to make location-based inferences that help you monitor and predict what crimes will occur where, when, and why.
Crime mapping with GIS technology
One of the most common forms of data insight that's used in law enforcement is the crime map. A crime map is a spatial map that visualizes where crimes have been committed during any given time interval. In olden days, you might have drawn this type of map out with pencil and paper, but nowadays you do the job using a GIS software, such as ArcGIS Desktop or QGIS.Although crime mapping has become increasingly sophisticated while advances have been made in spatial technologies, the purpose has remained the same — to provide law enforcement decision makers and personnel with location information that describes on-the-ground criminal activities so that they can use that information to optimize their efforts in protecting public safety. GIS software can help you make crime maps that can be used as a descriptive analytic or as a source for simple inference-based predictions.
Going one step further with location-allocation analysis
Location allocation is a form of predictive spatial analytics that you can use for location optimization from complex spatial data models. For example, in law enforcement, location optimization can predict optimal locations for police stations so that dispatched officers can travel to an emergency in any part of the city within a 5-minute response-time window. To help your agency predict the best locations to position officers so that they can arrive immediately at any emergency in any part of town, use location-allocation analysis.You can most easily do a location-allocation analysis by using the ArcGIS for Desktop Network Analyst add-on to carry out a maximum coverage analysis. (Check out ArcGIS for Desktop.) In this form of analysis, you input data about existing facilities, demand points — points that represent places in the study area that exhibit a demand for law enforcement resources — and any spatial barriers that would block or severely impede law enforcement response times. The model outputs information about the optimal locations to place officers for the fastest, most well-distributed response times. Packages such as the Network Analyst add-on are easy to use, which is one of the feature benefits that might have you choose ArcGIS over open-source QGIS. The figure shows map results that are derived from a location-allocation analysis.
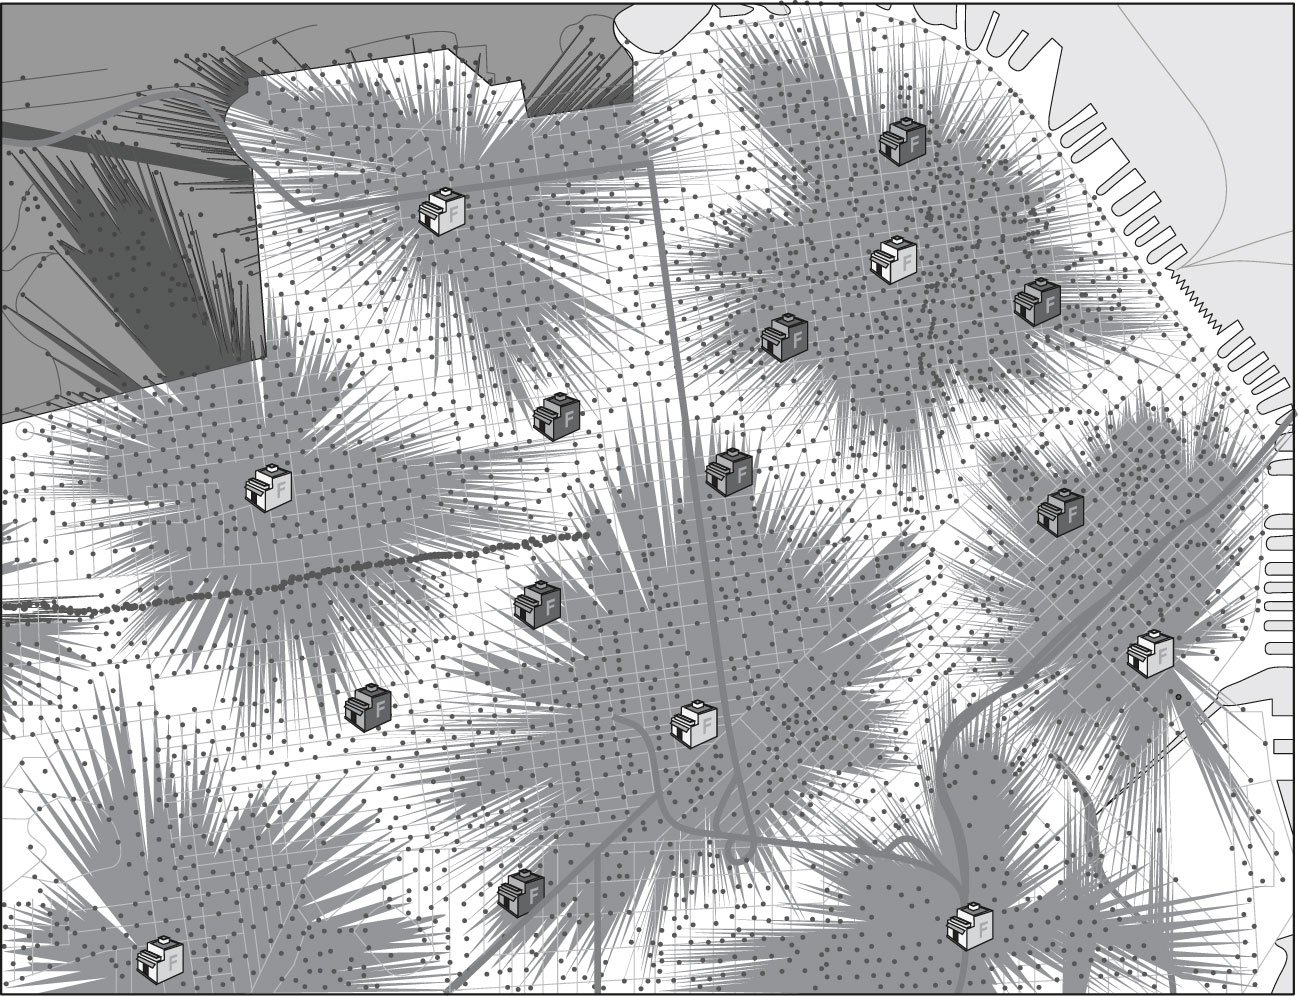 A map product derived from location-allocation analysis.


