


You can insert graphic shapes such as lines, rectangles, block arrows, stars, and other basic shapes into your Excel 2007 charts and worksheets. All you need to do is select a thumbnail on the Shapes drop-down gallery on the Insert tab of the Ribbon and then drag the shape out in the worksheet.
On the Insert tab, click the Shapes button in the Illustrations group.

The Shapes gallery appears, revealing nine categories of shapes, including Recently Used Shapes at the top.
Click a shape thumbnail to select it.
The Shapes gallery disappears and the mouse pointer changes to a crosshair.
Click and drag the mouse in the worksheet to create the shape in the desired size.
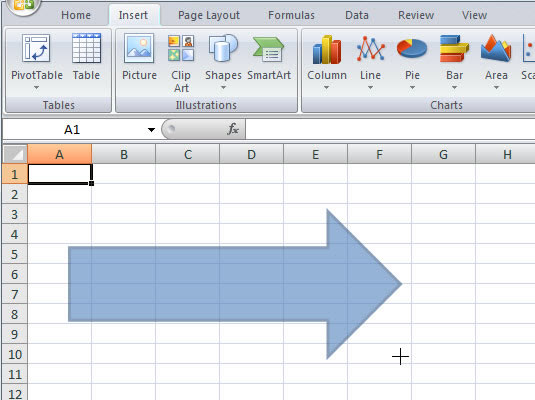
Drag the object until it’s approximately the size you want (you can fine-tune the size later).
Release the mouse button.
The shape appears in the worksheet.

