You don’t need to have an Office 365 subscription in order to use Power BI; there is a free version available to get you started, and a more advanced version (called Power BI Pro) for which you pay a small monthly subscription fee (around $10 a month). If you purchase an Office 365 E5 subscription, you get the Pro version of Power BI included.
You can use countless data sources for your Power BI reports. One option is to pull data directly from SharePoint’s Library app and List app.
How to pull data from a SharePoint Library app into Power BI
A SharePoint Library app includes content and also metadata about that content in the form of columns. You can pull this data into Power BI so that you can include it in your reports.To pull SharePoint Library app data into your Power BI report:
- In the Power BI Desktop app, click the Get Data drop-down menu located in the External Data section of the ribbon and select More. The Get Data dialog appears.
- Scroll down and choose SharePoint Folder, as shown in the following figure.
 Choosing a data source in the Power BI Desktop.
 - Click Connect.
- Enter the URL for your SharePoint site. In this example we enter https://sp2019fd.sharepoint.com/sites/SharePoint2019ForDummies.
- Click OK to connect.
- Enter the credentials the report will use to allow access to the SharePoint site. In this example we choose Microsoft Account, and we click Sign In so that we can use our Office 365 credentials.
- Click Connect to connect the Power BI Desktop with your SharePoint site.
Data from your SharePoint site will be displayed so you can preview it, as shown here.
 Loading data from a SharePoint Library app into the Power BI Desktop.
 - Click Load to load the data into the Power BI Desktop. Once your SharePoint data has finished loading, you can use it to build a report with Power BI. Some of the types of data you can include for content include Date Accessed, Date Created, Date Modified, File Extension, Folder Path, and Name.
How to pull data from a SharePoint List app
A SharePoint List app is similar to a spreadsheet. Your app contains columns and rows of data. These apps are central to SharePoint and you can import the data in them into your Power BI reports.Importing SharePoint List app data is the same process previously outlined for importing SharePoint Library app data; however, instead of selecting SharePoint Folder as a data source, select SharePoint List.
The Get Data dialog includes many different sources of data including all of the popular third-party sites such as GitHub, Google Analytics, Adobe, Facebook, Mailchimp, QuickBooks, Stripe, Twilio, Zendesk, Webtrends, and SurveyMonkey, just to name a few. If you have data you want to report on, chances are you can use Power BI to connect and report on it.
How to display a Power BI report on a SharePoint page
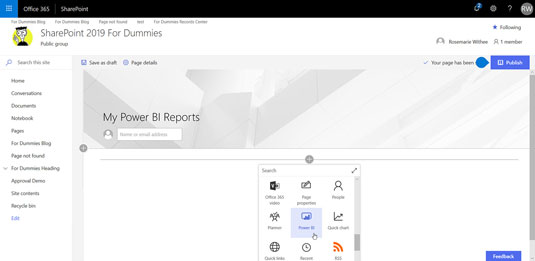
After you publish a Power BI report to the Power BI workspace website, people can view that report by opening their web browsers and entering a shareable link you provide to them. You can also embed a report directly into a SharePoint page on a SharePoint site.To embed a report on a SharePoint page, you must use a special Web Part for Power BI. To add a Power BI report, choose the Power BI Web Part, as shown in the following figure.
 Choosing the Power BI Web Part to add to a SharePoint page.
Once you add the Web Part to a page, you need to configure it. The configuration is very simple. You just provide the link to the Power BI report, and SharePoint takes care of rendering it for you right inside the SharePoint page, as shown here.

Rendering a Power BI report in SharePoint.People using SharePoint can now view your Power BI reports without ever realizing it. All a regular user knows is that a report shows up on the SharePoint page.
In order to share reports directly from your Power BI workspace, you will need the Power BI Pro license. This license comes with an Office 365 E5 subscription. You can also obtain a license for a stand-alone fee of approximately $10 per month.


