


The ZStandard, ZDecimal, ZTrip, and ZQuadrant1 zoom commands help you initially graph or regraph your function in a preset viewing window. To use these zoom commands, enter your function into the calculator, press [ZOOM], and then press the key for the number of the command. The graph automatically appears.
ZStandard zoom command on the TI-84 Plus
This command graphs your function in a preset viewing window where
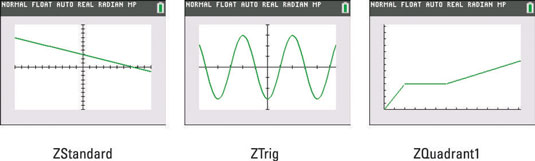
You access it by pressing [ZOOM][6]. See the first screen.
This Zoom command is the best way to begin graphing. After graphing the function using ZStandard, you can, if necessary, use the Zoom In and Zoom Out commands to get a better idea of the nature of the graph.
ZDecimal zoom command on the TI-84 Plus
This command graphs your function in a preset viewing window where
The ZDecimal command is accessed by pressing [ZOOM][4].
When you trace a function graphed in a ZDecimal window, the x-coordinate of the Trace cursor will be a multiple of 0.1.
ZTrig zoom command on the TI-84 Plus
This command, which is most useful when graphing trigonometric functions, graphs your function in a preset viewing window where
It also sets the tick marks on the x-axis to multiples of π/2. You access ZTrig by pressing [ZOOM][7]. See the second screen.
When you trace a function graphed in a ZTrig window, the x-coordinate of the Trace cursor will be a multiple of π/24.
ZQuadrant1 zoom command on the TI-84 Plus
This command graphs your function in a preset viewing window where
Of course, only Quadrant I can be viewed in this window. It is accessed by pressing [ZOOM][ALPHA][MATH], or by pressing [ZOOM] and using the up-arrow key to scroll to ZQuadrant1. See the third screen.
When you trace a function graphed in a ZQuadrant1 window, the x-coordinate of the Trace cursor will be a multiple of 0.1.

