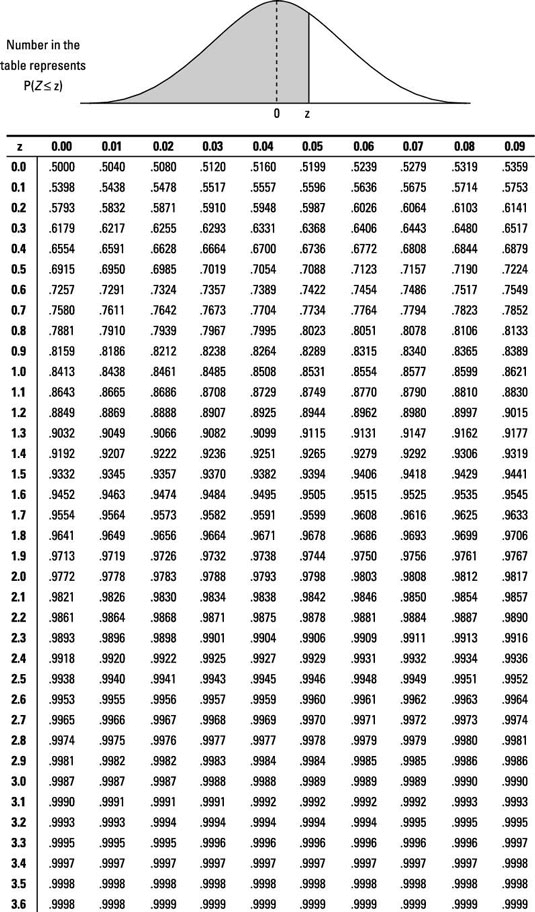
You can use the z-table to find a full set of "less-than" probabilities for a wide range of z-values. To use the z-table to find probabilities for a statistical sample with a standard normal (Z-) distribution, follow the steps below.
Using the Z-table
-
Go to the row that represents the ones digit and the first digit after the decimal point (the tenths digit) of your z-value.
-
Go to the column that represents the second digit after the decimal point (the hundredths digit) of your z-value.
-
Intersect the row and column from Steps 1 and 2.
This result represents p(Z < z), the probability that the random variable Z is less than the value Z (also known as the percentage of z-values that are less than the given z-value ).
For example, suppose you want to find p(Z < 2.13). Using the z-table below, find the row for 2.1 and the column for 0.03. Intersect that row and column to find the probability: 0.9834. Therefore p(Z < 2.13) = 0.9834.
Noting that the total area under any normal curve (including the standardized normal curve) is 1, it follows that p(Z < 2.13) + p(Z > 2.13) =1. Therefore, p(Z > 2.13) = 1 – p(Z < 2.13) which equals 1 – 0.9834 which equals 0.0166.
Symmetry in the distribution
Suppose you want to look for p(Z < –2.13). You find the row for –2.1 and the column for 0.03. Intersect the row and column and you find 0.0166; that means p(Z < –2.13)=0.0166. Observe that this happens to equal p(Z>+2.13). The reason for this is because the normal distribution is symmetric. So the tail of the curve below –2.13 representing p(Z < –2.13) looks exactly like the tail above 2.13 representing p(Z > +2.13).


