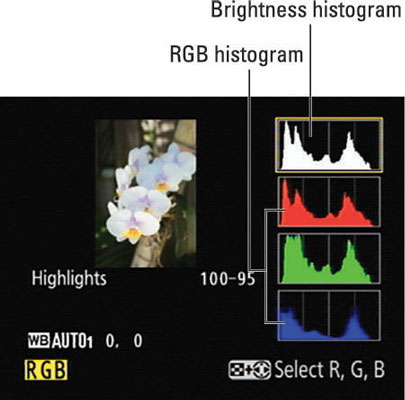
From Highlights mode on your Nikon D7100, you can press the Multi Selector down to get to RGB Histogram mode, which displays your image as shown on the left. (Remember: You can access this mode only if you enable it via the Playback Display Options setting on the Playback menu.)

The data underneath the thumbnail shows the White Balance settings used for the shot. The first value tells you the setting (Auto1, in the figure), and the two number values tell you whether you fine-tuned that setting along the amber to blue axis (first value) or green to magenta axis (second value). Zeros, as in the figure, indicate no fine-tuning.
You also see the Protect Status key and Retouch Indicator symbol if you use those features on the image.
In addition, you get four charts, called histograms. You actually get two types of histograms: The top one is a Brightness histogram and reflects the composite, three-channel image data. The three others represent the data for the single red, green, and blue channels. This trio is sometimes called an RGB histogram, thus the display mode name.
Highlights data: As with Highlights mode, blown highlights blink in the thumbnail, and you can view the warning for either the composite image (RGB) or each individual channel. Press the ISO button as you press the Multi Selector right to cycle between the single-channel and multichannel views.
A yellow box also surrounds the histogram representing the active view. For example, the RGB composite view is active in the figure. To get rid of the blinkies, select the Blue channel and then press the Multi Selector right one more time.

Zooming the view: Press the Qual button to zoom the thumbnail to a magnified view. The histograms then update to reflect only the magnified area of the photo. Press the Multi Selector to scroll the image display. To return to the regular view, press OK.

Reading a Brightness histogram
You can get an idea of image exposure by viewing your photo on the monitor and by looking at the blinkies in Highlights mode, but the Brightness histogram provides a way to gauge exposure that’s a little more detailed.
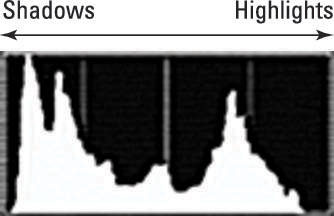
A Brightness histogram indicates the distribution of shadows, highlights, and midtones (areas of medium brightness) in your image.
The horizontal axis of the histogram represents possible brightness values — the maximum tonal range, in photography-speak — from the darkest shadows on the left to the brightest highlights on the right. And the vertical axis shows you how many pixels fall at a particular brightness value. A spike indicates a heavy concentration of pixels at that brightness value.

There is no one “perfect” histogram that you should try to achieve. Instead, interpret the histogram with respect to the distribution of shadows, highlights, and midtones that comprise your subject. You wouldn’t expect to see lots of shadows, for example, in a photo of a polar bear walking on a snowy landscape.
Pay attention, however, if you see a very high concentration of pixels at the far right or left end of the histogram, which can indicate a seriously overexposed or underexposed image, respectively.
Understanding RGB histograms
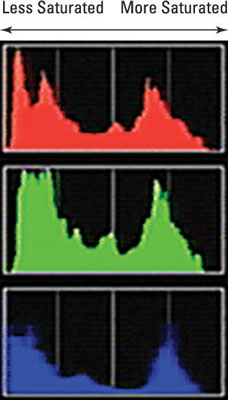
In RGB Histogram display mode, you see two histograms: the Brightness histogram and an RGB histogram.

Digital images are made up of red, green, and blue light. With the RGB histograms, you can view the brightness values for each of those color channels. Overexposure in one or two channels can produce oversaturated colors — and thus a loss of picture detail. So, if most of the pixels for one or two channels are clustered toward the right end of the histogram, adjust your exposure settings and try again.
Photographers schooled in the science of RGB histograms can spot color-balance issues by looking at the pixel values, too. But frankly, color-balance problems are easy to notice just by looking at the image itself on the camera monitor.


