At some point, you want to publish the information you create in MATLAB. Of course, most of the time, you don’t need to publish a matrix or other source data. What you want to publish are the plots you create from the data. A picture is worth a thousand words — you’ve heard the phrase a million times, yet it still holds true.
Performing advanced script and function publishing tasks
The publish() function can perform a number of different sorts of publishing tasks. The simplest way to publish a script or function is to call publish() with the name of the file. This approach produces an HTML file output. If you want to specify a particular kind of output, you provide the file format as the second input, such as publish(‘Bar1.m’, ‘pdf’). MATLAB supports the following output formats:
.doc
.html (default)
.latex
.pdf
.ppt
.xml
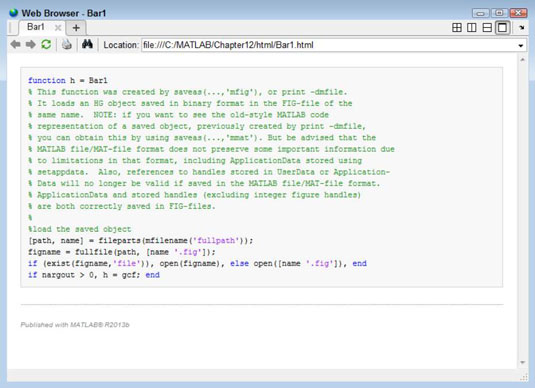
After you finish publishing a script or function in HTML format, you can view it using the web() function. To test this feature, first publish the Bar1.m script by typing publish(‘Bar1.m’) and pressing Enter. After you see the success message, type web(‘htmlBar1.html’) and press Enter. You see the MATLAB browser output.
However, even if this output looks perfect, always test the published output using the applications that your viewers will use to ensure that everything displays correctly.

You can also use a version of publish() with name and value pair options. This version of publish() gives you the most control over the published output. You can control precisely where the document is saved and the size of any images provided with the output. Here is a list of the options and how you can use them.
| Name | Values | Type | Description |
|---|---|---|---|
| catchError | true (default) or false | Code | Determines how MATLAB handles errors during the publishing process. |
| codeToEvaluate | String containing the required code | Code | Allows you to provide additional code with the published document so that it’s possible to perform tasks such as evaluating the code when the associated function requires inputs. |
| createThumbnail | true (default) or false | Figure | Determines whether the output document contains a thumbnail version of the full image (when an image is part of the output). |
| evalCode | true (default) or false | Code | Forces MATLAB to evaluate the code as it publishes the script or function, which results in additional details in the output file in some cases. |
| figureSnapMethod | entireGUIWindow (default), print, getframe, or entireFigureWindow | Figure | Defines the technique used to obtain the figure contained within the published document. |
| format | doc, html (default), latex, pdf, ppt, and xml | Output | Determines the format of the published document. |
| imageFormat | png, epsc2, jpg, bmp, tiff, eps, eps2, ill, meta, or pdf | Figure | Indicates the format of the figure contained within the published document. The default setting depends on the output document format. Some document formats won’t access all the format types. For example, PDF output is limited to the bmp or jpg options, but XML output can accept any of the file formats. |
| maxHeight | ‘‘ (default) or positive integer value | Figure | Determines the maximum height of the figure contained within the published document. |
| maxOutputLines | Inf (default) or non-negative integer value | Code | Specifies the number of lines of code that MATLAB includes in the published document. Setting this value to 0 means that no code is in the output. |
| maxWidth | ‘‘ (default) or positive integer value | Figure | Determines the maximum width of the figure contained within the published document. |
| outputDir | ‘‘ (default) or full path to output directory | Output | Specifies where to place the published document on disk. |
| showCode | true (default) or false | Code | Determines whether the published document contains any source code. |
| stylesheet | ‘‘ (default) or full path and XSL filename | Output | Specifies the location and name of an XSL file to use when generating XML file output. |
| useNewFigure | true (default) or false | Figure | Specifies that MATLAB is to create a new figure prior to publishing the document. |
Saving your figures to disk
You must save your figures to disk if you want to use them the next session. However, saving a figure to disk can also help you publish the information in a form that lets others use the information as well. The format you choose determines how the saved information is used. Only the MATLAB figure (.fig) format provides an editable form that you can work with during the next session.
Using the GUI to save figures
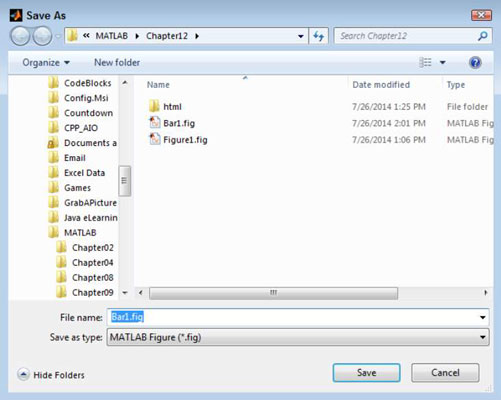
To save an entire figure, choose File→Save As in the figure window. You see the Save As dialog box. Type a name for the file in the File Name field, select the format that you want to use to save the file in the Save As Type field, and click Save to complete the process.
Using commands to save figures
The command version of saving a figure depends on the saveas() command. To use this command, you supply a handle to the figure that you want to save as the first argument. The second argument is a filename. When you provide a type of file format to use as the third argument, the filename need not include a file extension.
However, if you provide just the filename, you must provide an extension as well. MATLAB supports these file formats:
.ai
.bmp
.emf
.eps
.fig
.jpg
.m
.pbm
.pcx
.pdf
.pgm
.png
.ppm
.tif
The handle that you provide need not be the figure itself. For example, if you type saveas(TBox1, ‘TBox1.jpg’) and press Enter, MATLAB still saves the entire figure. (Note that you have no way to specify that you want to save just a portion of the figure.)


