Although the subject of using the Power Query Editor to perform advanced queries is a complicated topic, basic use of the Power Query Editor should prove to be no problem as the Power Query Editor’s interface and essential features are very similar to those of Excel 2019.
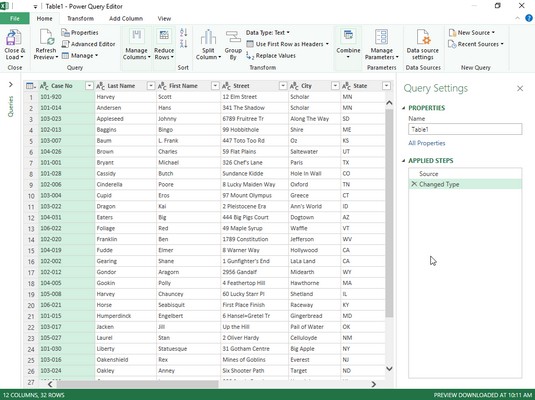
The following image shows the Power Query Editor window after opening it to create a new query with the Bo-Peep Client list data table entered into the current Excel worksheet (in the cell range, A1:I34 and named, Client_List). To create the new query, all you have to do is select the Excel range before clicking the From Table/Range command button on the Data table of the Ribbon.
 Creating a new query in the Power Query Editor using a data table created in an Excel worksheet.
As you see, in the Power Query Editor, the imported Excel client data table retains its worksheet row and column arrangement with the column headings complete with Auto-Filter drop-down buttons intact. Above the data table, the Power Query Editor sports a Ribbon type command structure with a File menu followed by four tabs: Home, Transform, Add Column, and View. To the right of the imported data table, a Query Settings task pane appears that not only displays the source of the data (a worksheet cell range named Client_List) but also all the steps applied in building this new query.
Once the Bo-Peep data records are loaded into the Power Query Editor, you can use its commands to query the data before returning the subset of records to a new worksheet in Excel. For this query, you are thinking of creating a subset of records where the status of the file is still active and the account is marked unpaid (in other words, all the clients who still owe the company money).
To do this, use the AutoFill buttons on the Status and Paid fields to filter the records to display just those with Active in the Status field and No in the Paid field. Then, sort the records by from the highest to lowest amount owed by sorting on the Total Due field in descending order. After that, you’re ready to select the Close & Load To option on the Close & Load command button on the Home tab to save the query and load it into a new worksheet in the current workbook. To do this, simply accept the default settings of Table and New Worksheet in the Import Data dialog box that appears after selecting the Close & Load To option prior to click OK.
 Setting the filtering and sorting criteria for the new data query in the Power Query Editor.
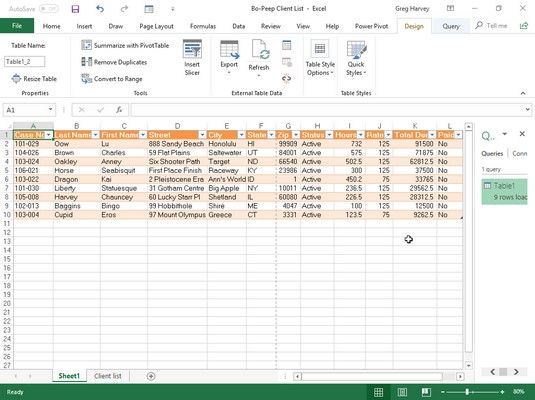
The following image shows you the results. Here you see the new Excel worksheet that the Editor created (Sheet 1 in front of the Client List sheet) before it copied the filtered and sorted subset of the Bo-Peep records into a new data table in cell range A1: L10. When the Power Query Editor imported this new data table, the program also assigned it a table style, added AutoFilter buttons, and opened a Queries & Connections task pane. Now all that’s left to do is a bit of formatting, renaming the worksheet, and sending past due notices to all the delinquent clients listed in this table!
 The Bo-Peep data queried in the Power Query Editor after loading it into a new Excel worksheet.


