Think of Power BI as a website that lets you connect hundreds of data sources to it so you can build reports and integrate those reports in other products (like Office 365).
Power BI for Office 365 and Power BI are two separate products. Power BI for Office 365 has gone away and Power BI is the next evolution of it. Power BI comes with your Office 365 E5 subscription or you can purchase licensing for it separately. It even starts with a free trial.
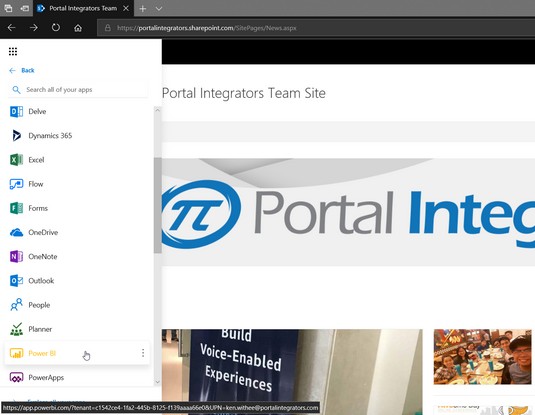
To access Power BI, go to your Office 365 tenant and select it from the app menu on the left side of your screen. Accessing Power BI from the Office 365 apps menu.
Pulling data into Power BI
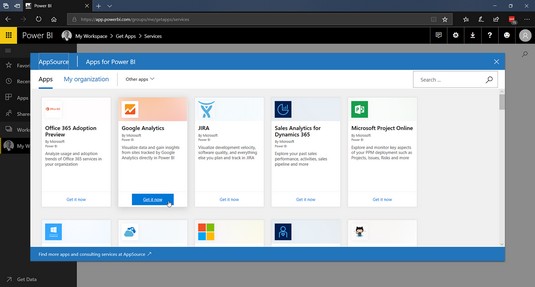
When you first open Power BI you are prompted to add data. You can get data from a number of sources, but the easiest and quickest way to add data to Power BI is to pull data from the apps and services your organization already uses. For example, you can connect to everything from Google Analytics to GitHub to MailChimp and ZenDesk. And of course you can connect to other Office 365 apps as well!To pull data into Power BI to analyze, click the Get button under Services from the initial landing page. You will then be presented with options for the services from which you can pull data.
 Adding apps for services to pull data into Power BI.
In this case, let’s pull in some data from a local Excel file. Power BI uses a concept called Workspaces to keep things organized. By default, you have a workspace that is just for you. You can create organizational workspaces, but you will need something beyond the free plan to do so.
To pull Excel data into Power BI:
- Navigate to the Power BI website.You can find Power BI on the apps menu in Office 365 or you can navigate to it directly at app.powerbi.com.
- On the welcome screen, click the Get button in the Files box under the Create New Content section.You can also get to this welcome screen by clicking on the Workspaces tab on the left and selecting your personal workspace.
 Adding local data to Power BI.
 - Choose the location of the Excel file you want to import.
If it is on your local computer, choose Local File. If it is in your OneDrive or SharePoint site, select those options. This example uses the Financial Sample data Microsoft provides.
- Choose whether you want to connect Power BI to your Excel file or import the entire Excel file into Power BI.
 An Excel files data imported into Power BI as a dataset.
You are now ready to build reports and share them with others.
Creating reports in Power BI
Once you have data connected to Power BI, you are ready to create a report. A report consists of elements such as bar charts and graphs. To begin creating a report:- Click the Reports tab in your Workspace and then click the Create button in the upper-right corner.
- Choose the dataset you just imported and click Create.
In this case it is the Financial Sample from Microsoft. The report builder page appears and you can build your report by adding visuals such as charts, graphs, and filters. The report builder page can be overwhelming at first, but as you play around with it you will find it is rather like Excel.
- Click the line chart to add the control to the report and then select the data for Month Name and Sales.
 A simple report showing sales by month.
 - Click the Save button on the upper-right corner of the report builder and give the report a name.
- Click on your Workspace again and select the Reports tab to see your shiny new report.You can view the report in your browser by clicking on it.
Displaying reports in Office 365
You can always display your reports in a Workspace that others can navigate to through the Power BI interface. In our case, let’s embed our report in a SharePoint site so that it becomes part of the intranet portal.To add a Power BI report to a SharePoint page, follow these steps:
- Navigate to the SharePoint page where you want to add the report.
- Click the plus icon and select Power BI.
 Adding a Power BI report to a SharePoint page.
 - On the Power BI control that appears, click the Add Report button.
- Paste in the URL of the report and press Enter.
This is the address from the web browser when you viewed the report earlier in the previous steps.
The report is embeded in the page.
- Click the Publish button to publish your page to the SharePoint site.
When you are ready to take the next step, you can jump into PowerApps and Microsoft Flow for building mobile apps and creating workflows.


